


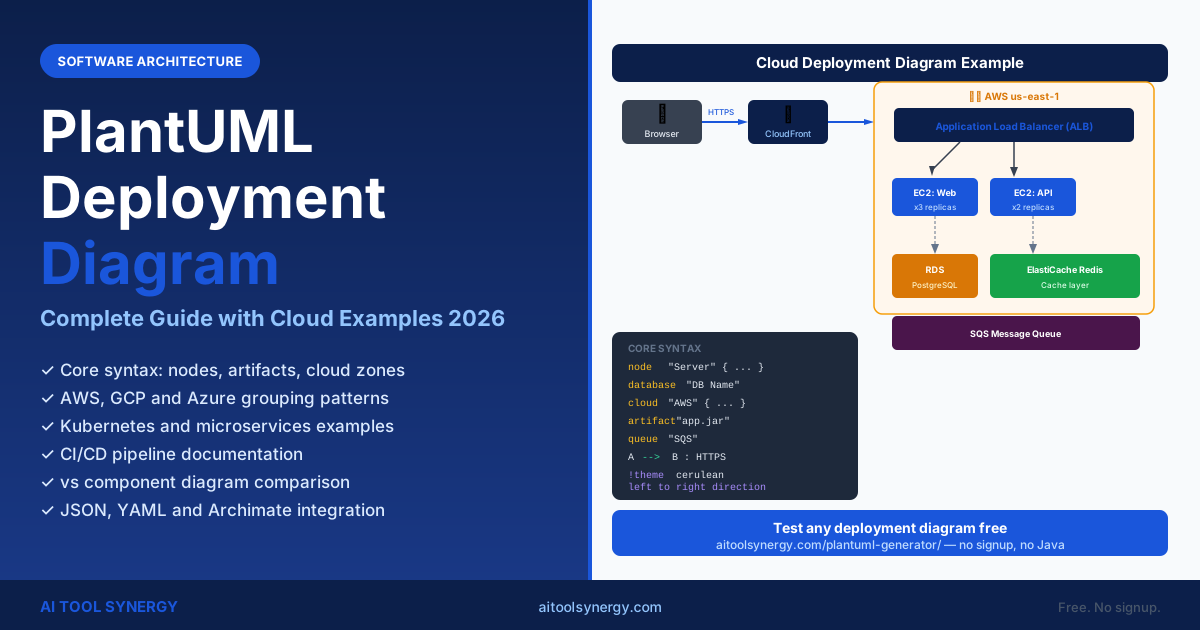
PlantUML Deployment Diagram: Complete Guide with Cloud Examples (2026)
A plantuml deployment diagram shows where software runs — the physical and virtual infrastructure including servers, containers, cloud zones, load balancers, and databases. Unlike a component diagram that shows what software modules exist, a deployment diagram shows how those modules are distributed across real infrastructure.
This guide covers the full plantuml deployment diagram syntax — nodes, artifacts, cloud grouping for AWS, GCP, and Azure, microservices patterns, DevOps CI/CD documentation, JSON and YAML visualization, Archimate integration, and styling. Every example is ready to run in any PlantUML editor.
All code examples work in our free PlantUML generator online — no Java needed, no install. Generate, preview, and export your deployment diagram as PNG or SVG directly in the browser in under 30 seconds.
What Is a PlantUML Deployment Diagram and Who Uses It?
A plantuml deployment diagram shows where software runs — the physical and virtual infrastructure including servers, VMs, containers, cloud zones, load balancers, and databases. It answers the question “where does this software live?” rather than “what does it do?” or “how do components connect?”
DevOps engineers use deployment diagrams for cloud architecture documentation and infrastructure reviews. SREs use them for incident response runbooks. Cloud architects use them for migration planning. Technical writers embed them in system documentation to give non-developers a clear picture of the production environment.
PlantUML Deployment Diagram Core Syntax: Nodes, Artifacts and Links
The plantuml deployment diagram uses four primary syntax elements: node for physical and virtual machines, database for data stores, artifact for deployable software units placed on a node, and grouping constructs (cloud, rectangle, frame) for zones and boundaries. Arrows define communication paths.
Core Syntax Elements
| Element | Syntax | Renders As | Use For |
|---|---|---|---|
| Node | node "Name" as ALIAS | 3D server box | Servers, VMs, containers, devices |
| Database | database "Name" as ALIAS | Cylinder | RDBMS, NoSQL, data stores |
| Artifact | artifact "name.jar" as A | Document icon | Deployable file: .jar, .war, .zip |
| Component | component "Name" as C | Component box | Software running on a node |
| Cloud | cloud "Provider" { ... } | Cloud outline | Cloud provider zone |
| Node group | node "Server" { artifact "app" } | Server with content | Hosted artifact on specific node |
| Frame | frame "Name" { ... } | Framed boundary | Network zone or region |
| Rectangle | rectangle "Name" { ... } | Rectangle boundary | Generic infrastructure zone |
| Queue | queue "Name" as Q | Cylinder (horizontal) | Message queues |
| Stack | stack "Name" { ... } | Stacked box | Technology stacks |
| Dependency | A --> B : label | Solid arrow | Communication / dependency |
| Association | A -- B | Line (no arrow) | Physical connection |
Basic Deployment Diagram
@startuml
node "Web Server" as WS {
  artifact "frontend.war" as APP
}
node "App Server" as AS {
  artifact "backend.jar" as API
}
database "PostgreSQL" as DB
node "Cache Server" as CS {
  database "Redis" as CACHE
}

WS --> AS : HTTP/REST
AS --> DB : JDBC
AS --> CACHE : TCP 6379
@enduml
Test any syntax from the table above instantly in our free PlantUML generator online — paste the code, hit Generate, and export the result as PNG or SVG in one click.
artifact for the specific deployable file (myapp-2.1.jar, nginx.conf, docker-compose.yml). Use component for a running software module when you do not need to reference a specific file. Artifacts are placed inside a node to show which server hosts them.PlantUML Deployment Diagram Cloud Grouping: AWS, GCP and Azure
The plantuml deployment diagram supports cloud provider groupings using the cloud keyword. Nest nodes and databases inside cloud blocks to represent services within AWS regions, GCP projects, or Azure resource groups. Multiple cloud blocks in one diagram show multi-cloud or hybrid cloud architectures clearly.
AWS Cloud Architecture Example
@startuml
!theme cerulean

node "End User" as USER

cloud "AWS Region: us-east-1" {
  node "ALB (Load Balancer)" as ALB
  node "EC2: Web (x3)" as EC2
  node "EC2: Worker (x2)" as WORKER
  database "RDS PostgreSQL (Multi-AZ)" as RDS
  database "ElastiCache Redis" as CACHE
  queue "SQS Queue" as SQS
}

cloud "AWS Route 53" {
  [DNS]
}

cloud "AWS CloudFront" {
  [CDN]
}

USER --> [DNS] : HTTPS
[DNS] --> [CDN]
[CDN] --> ALB : origin
ALB --> EC2
EC2 --> RDS : JDBC
EC2 --> CACHE : Redis
EC2 --> SQS : publish
SQS --> WORKER : consume
WORKER --> RDS : JDBC
@enduml
Multi-Cloud Architecture Example (AWS + GCP)
@startuml
cloud "AWS (Primary)" {
  node "API Servers (EC2)" as API
  database "Primary DB (RDS)" as DB1
}

cloud "GCP (Analytics)" {
  node "Analytics Service" as ANALYTICS
  database "BigQuery" as BQ
}

cloud "CDN / Edge" {
  [CloudFront]
}

[CloudFront] --> API
API --> DB1
API --> ANALYTICS : events via HTTPS
ANALYTICS --> BQ : streaming insert
@enduml
PlantUML Deployment Diagram for Microservices Architecture
A plantuml deployment diagram for microservices shows each service as a component or node, grouped by its deployment environment. Kubernetes clusters, Docker Swarm nodes, and cloud provider zones appear as grouping constructs. API gateways, load balancers, and message queues appear as connecting infrastructure nodes.
@startuml
!theme materia

node "Client" as CLIENT

cloud "Kubernetes Cluster (EKS)" {
  node "Ingress Controller" as IC
  node "Pod: User Service (x2)" as US
  node "Pod: Order Service (x2)" as OS
  node "Pod: Payment Service" as PS
  node "Pod: Notification Service" as NS
}

cloud "Managed AWS Services" {
  database "User DB (RDS)" as UDB
  database "Order DB (RDS)" as ODB
  queue "Order Events (SQS)" as SQS
  node "Email (SES)" as SES
}

CLIENT --> IC : HTTPS
IC --> US
IC --> OS
US --> UDB : JDBC
OS --> ODB : JDBC
OS --> PS : gRPC
OS --> SQS : publish
SQS --> NS : consume
NS --> SES : SMTP
@enduml
For community examples of real microservices deployment diagrams across different stack types, real-world-plantuml.com maintains a gallery of production-grade PlantUML diagrams contributed by teams using the tool in practice.
node "API Service (x3)") and use arrow labels for protocols (HTTPS, gRPC, AMQP). Keep the diagram to one cloud region or cluster per diagram — create separate diagrams for DR regions and link them with a reference note.PlantUML Deployment Diagram vs Component Diagram: Key Differences
These two diagram types both show system structure but at different levels. Teams often use both together — the component diagram for design reviews and developer onboarding, the deployment diagram for operations, cloud cost planning, and incident response documentation.
- Shows where software runs physically or virtually
- Elements:
node,artifact,database,cloud - Includes servers, VMs, containers, cloud zones
- Maps to C4 model level C2 (Container) and infrastructure
- Primary audience: DevOps, SRE, cloud architects, ops teams
- Used for: capacity planning, DR docs, cloud migration, incident runbooks
- Shows what software modules exist and how they connect logically
- Elements:
[component],() interface,package - Ignores physical location — no servers or cloud zones
- Maps to C4 model level C3 (Component)
- Primary audience: developers, architects, tech leads
- Used for: API design, onboarding docs, architecture reviews, refactoring
Stereotypes, Custom Icons and Sprite Integration
PlantUML deployment diagrams support stereotypes — labels in angle brackets like <<AWS>>, <<kubernetes>>, or <<loadbalancer>> — that add visual context to generic nodes without changing the layout. Stereotypes work with skinparam to apply custom colors to each type, making large infrastructure diagrams easier to read.
@startuml
skinparam node {
  BackgroundColor<> #dbeafe
  BorderColor<> #1a56db
  BackgroundColor<> #fef3c7
  BorderColor<> #d97706
  BackgroundColor<> #dcfce7
  BorderColor<> #16a34a
}

node "Web Server" <> as WEB
node "App Server" <> as APP
database "Primary DB" <> as DB
database "Redis Cache" <> as CACHE

WEB --> APP : HTTP
APP --> DB : SQL
APP --> CACHE : TCP
@enduml
For AWS, GCP, and Azure-specific icons, the PlantUML Standard Library includes icon sets for all major cloud providers. Include them with !include <awslib/AWSCommon> and use the macro names to render official service icons inside your deployment diagram nodes.
JSON and YAML Data Visualization in PlantUML
PlantUML includes dedicated JSON and YAML diagram types separate from deployment diagrams. These are useful alongside deployment documentation — for example, rendering a Kubernetes manifest or a Terraform config as a visual tree to explain infrastructure-as-code structure to stakeholders.
JSON Diagram (Kubernetes Config)
@startjson
{
  "cluster": "production-eks",
  "region": "us-east-1",
  "services": {
    "api": {"replicas": 3, "port": 8080},
    "worker": {"replicas": 2, "port": 8081},
    "ingress": {"type": "alb", "port": 443}
  },
  "databases": {
    "primary": "rds-postgres-16",
    "cache": "elasticache-redis-7"
  }
}
@endjson
YAML Diagram (Docker Compose)
@startyaml
version: "3.9"
services:
  web:
    image: nginx:alpine
    ports:
      - "80:80"
    depends_on:
      - api
  api:
    image: myapp:v2.1
    environment:
      - DB_HOST=postgres
    depends_on:
      - postgres
  postgres:
    image: postgres:16
    volumes:
      - pgdata:/var/lib/postgresql/data
@endyamlPlantUML Deployment Diagram for DevOps and CI/CD Pipelines
A plantuml deployment diagram maps CI/CD pipelines naturally — each pipeline stage becomes a node, and the pipeline steps become labeled arrows between them. This produces a clear visual pipeline document readable by all team members, including non-engineers who need to understand the deployment flow.
For a detailed walkthrough of the GitHub Actions + PlantUML workflow including auto-commit configuration, this tutorial on DEV.to covers the full setup step by step.
CI/CD Pipeline as Deployment Diagram
@startuml
!theme cerulean
left to right direction

node "Developer Workstation" as DEV {
  artifact "feature-branch.git"
}
node "GitHub Repository" as GH
node "GitHub Actions Runner" as CI {
  artifact "ci-pipeline.yml"
}
node "Container Registry (ECR)" as ECR
node "Staging Environment" as STG {
  node "ECS (staging)"
}
node "Production Environment" as PROD {
  node "ECS (prod)"
  node "CloudFront CDN"
}

DEV --> GH : git push
GH --> CI : trigger on PR merge
CI --> ECR : docker push :latest
CI --> STG : deploy (auto)
STG --> PROD : promote (manual approval)
@enduml
Kubernetes Deployment Pipeline
@startuml
node "Source" as SRC
node "CI (GitHub Actions)" as CI {
  artifact "Dockerfile"
  artifact "k8s-manifests/"
}
node "Image Registry" as REG
cloud "Kubernetes (Prod)" {
  node "Deployment: API (x3)" as API
  node "Deployment: Worker (x2)" as WRK
  node "Service (ClusterIP)" as SVC
  node "Ingress (ALB)" as ING
}

SRC --> CI : push
CI --> REG : docker build + push
CI --> ING : kubectl apply
ING --> SVC
SVC --> API
SVC --> WRK
@enduml
Styling a PlantUML Deployment Diagram: Themes and Skinparam
A plantuml deployment diagram responds to all standard skinparam properties and the full built-in theme library. Node-specific skinparam controls the visual appearance of server and infrastructure boxes. Apply a theme first with !theme, then use skinparam for targeted overrides of specific infrastructure element types.
Deployment Diagram Skinparam Reference
| Property | Example Value | Controls |
|---|---|---|
skinparam NodeBackgroundColor | #dbeafe | Server/node box fill color |
skinparam NodeBorderColor | #1a56db | Server/node box border |
skinparam NodeFontColor | #0c1f4a | Node label text color |
skinparam DatabaseBackgroundColor | #fef3c7 | Database cylinder fill |
skinparam DatabaseBorderColor | #d97706 | Database cylinder border |
skinparam ArtifactBackgroundColor | #f0fdf4 | Artifact document fill |
skinparam CloudBackgroundColor | #fff7ed | Cloud zone fill |
skinparam CloudBorderColor | #f59e0b | Cloud zone outline |
skinparam ArrowColor | #374151 | All arrows |
skinparam Shadowing | false | Remove drop shadows |
@startuml
skinparam NodeBackgroundColor #dbeafe
skinparam NodeBorderColor #1a56db
skinparam NodeFontColor #0c1f4a
skinparam DatabaseBackgroundColor #fef3c7
skinparam DatabaseBorderColor #d97706
skinparam CloudBackgroundColor #f1f5f9
skinparam CloudBorderColor #94a3b8
skinparam ArrowColor #374151
skinparam Shadowing false
skinparam RoundCorner 8

cloud "Production" {
  node "API Server" as API
  database "PostgreSQL" as DB
}
API --> DB : SQL
@enduml
For a full theme and skinparam reference including all deployment diagram property names, see our PlantUML skinparam guide. For all deployment element syntax in one place, bookmark our PlantUML cheat sheet.
Archimate and Timing: Companion Diagram Types
PlantUML supports Archimate and timing diagrams as separate diagram types that complement deployment diagrams in enterprise architecture documentation. Archimate covers three architecture layers — Business, Application, and Technology — and can document the strategic context above the infrastructure level that deployment diagrams show.
PlantUML timing diagrams are useful alongside deployment diagrams for showing time-based behaviour, such as how a blue-green deployment transitions traffic between two production environments over a deployment window. See the official Archimate diagram reference and the deployment diagram syntax reference for syntax details on both types.
@startuml
' Timing diagram: blue-green deployment traffic shift
concise "Production (Blue)" as BLUE
concise "Production (Green)" as GREEN
concise "Load Balancer" as LB

@0
BLUE : 100% traffic
GREEN : idle
LB : blue-only

@15
BLUE : 50% traffic
GREEN : 50% traffic
LB : canary split

@30
BLUE : 0% traffic
GREEN : 100% traffic
LB : green-only

@45
BLUE : drained
GREEN : active
LB : complete
@enduml
Every plantuml deployment diagram example in this guide — including cloud architecture, microservices, CI/CD pipelines, and the timing diagram above — works in our free online PlantUML generator. Paste any code block, render, and export as PNG or SVG with no install or Java required.
PlantUML Deployment Diagram — Frequently Asked Questions
A plantuml deployment diagram documents where software runs — mapping applications to servers, VMs, containers, or cloud services. Common uses include cloud architecture documentation, DevOps runbooks, infrastructure migration planning, Kubernetes cluster documentation, and capacity planning reviews. It answers “where does this system live?” rather than “how does the code work?”
A component diagram shows what software modules exist and how they connect logically — it has no servers or cloud zones. A deployment diagram shows where those modules run physically or virtually — servers, Kubernetes pods, cloud services, and network zones. Use both together: component diagram for developer onboarding, deployment diagram for operations documentation.
Use the cloud "AWS Region Name" { ... } syntax to create a cloud zone, then nest node, database, and queue elements inside it for specific services. For official cloud provider icons, include the PlantUML Standard Library with !include <awslib/AWSCommon> to use AWS service macros with official branding.
A node in PlantUML represents any physical or virtual computing resource — a bare-metal server, a VM, a Docker container, a Kubernetes pod, or a cloud instance. It renders as a 3D box by default. You can place artifact, component, or database elements inside a node to show what software runs on that resource.
Yes — use a cloud "Kubernetes Cluster" block and add node "Pod: ServiceName" elements inside it. For Docker Compose, use a rectangle "Docker Host" block with nested node elements for each service container. Arrow labels show the network protocol — HTTP, gRPC, TCP — between containers or pods.
A node represents a computing resource (server, VM, container). An artifact represents a deployable software file (myapp.jar, nginx.conf, docker-image:v2.1) that runs on a node. Place artifacts inside node blocks to show which server hosts which software file. If you do not need to reference a specific file, use component inside the node instead.
Add !theme cerulean after @startuml for a quick preset. For custom colors, use skinparam NodeBackgroundColor, skinparam NodeBorderColor, skinparam DatabaseBackgroundColor, and skinparam CloudBackgroundColor. Combine stereotypes with skinparam to use different colors for different infrastructure types within the same diagram.
Yes — CI/CD pipelines map naturally to deployment diagrams. Each pipeline stage (developer machine, CI runner, container registry, staging, production) becomes a node. Pipeline steps become labeled arrows showing what triggers each transition (git push, docker build, kubectl apply, manual approval). This produces a clear pipeline visual for sprint planning and DevOps onboarding documentation.
Use multiple cloud "Provider Name" blocks side by side in a single diagram. Connect them with labeled arrows for data flows and protocols between providers. Add left to right direction to spread cloud zones horizontally — this keeps multi-cloud diagrams readable in Confluence pages and on wide screens.
Related Articles