


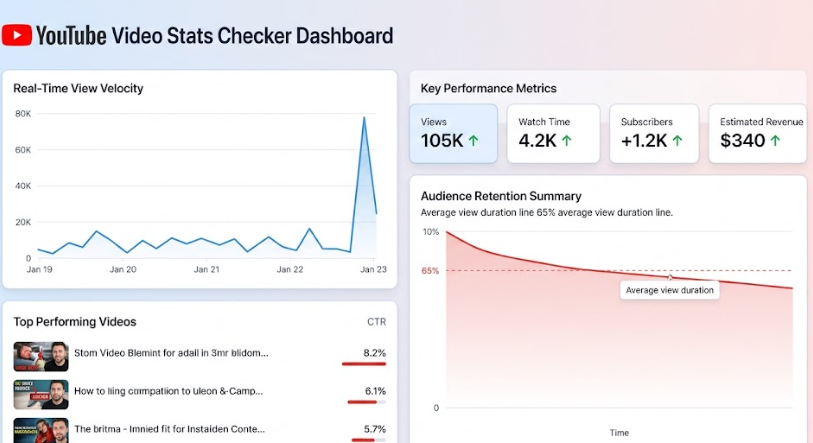
Discover how a YouTube Video Stats Checker helps you track 7 key metrics, boost audience retention, optimize video SEO, and scale your channel fast.
YouTube Video Stats Checker
Table of Contents
1. Introduction: Why Data-Driven Decisions Rule YouTube
Navigating the competitive landscape of digital video creation requires far more than creative intuition. With hundreds of hours of video content uploaded every minute, standing out on YouTube demands a structured, analytical approach. Creators who consistently top search rankings and secure spots on recommended feeds rely heavily on precise analytics. Utilizing a robust YouTube Video Stats Checker allows channel managers, marketers, and independent creators to decode raw metrics into actionable growth strategies.
In the early days of online video, raw view counts served as the single primary benchmark of popularity. Today, the YouTube recommendation algorithm has evolved into a multi-layered neural network designed to maximize viewer satisfaction and long-term platform engagement. Simple views no longer guarantee long-term reach. Instead, metrics like audience retention rates, impression click-through rates, session duration, and audience loyalty determine whether your upload surfaces on the home feed or fades into obscurity.
Using a specialized YouTube Video Stats Checker right from the beginning of your content lifecycle allows you to understand how viewers interact with your content. By evaluating performance metrics shortly after publishing, you can make real-time adjustments to titles, thumbnails, descriptions, and video structure. This continuous feedback loop transforms content creation from guesswork into a repeatable, data-backed strategy for channels of any scale.
2. What Is a YouTube Video Stats Checker and How Does It Work?
A YouTube Video Stats Checker is a specialized analytical tool or web service designed to aggregate, process, and display vital data points related to specific YouTube videos and channels. While YouTube provides baseline analytics within Creator Studio, dedicated statistics checkers pull deeper real-time data, historical benchmarks, and comparative insights via official API connections.
At its technical core, a stats checker interfaces directly with data feeds to extract public and backend metadata. It organizes complex data strings—such as view velocity, engagement percentages, estimated tag rankings, and historical growth curves—into accessible, visual dashboards. This structured visualization allows creators to audit performance without getting bogged down by raw data tables.
Understanding the underlying mechanics of video statistics tools reveals why they are indispensable for competitive channels. Standard creator dashboards often show delayed updates or high-level summaries. In contrast, advanced analytics tools evaluate performance dynamics relative to historical category benchmarks. They help answer critical questions: Is your latest video outperforming your channel average? Is a sudden dip in traffic caused by seasonality, title fatigue, or algorithm shifts?
Furthermore, public statistical checkers allow creators to conduct competitive research across rival channels. By inspecting the performance dynamics of top-performing videos in your niche, you can spot emerging content trends, audience demand gaps, and high-converting keyword patterns before they become overly saturated.
Alt Text: Analyzing an audience retention graph inside a YouTube Video Stats Checker to locate viewer drop-off points.
3. 7 Powerful Ways to Track Success Using a YouTube Video Stats Checker
To maximize the value of your data, you must know which metrics to prioritize and how to interpret them. Below are seven fundamental strategies for using a YouTube Video Stats Checker to improve video performance and drive sustainable channel growth.
Method 1: Monitoring Audience Retention and Early Drop-Off Points
Audience retention is arguably the most critical metric evaluated by the YouTube algorithm. It measures the exact percentage of viewers watching your video at any given timestamp. A high retention rate signals to YouTube that your video delivers on its promise, making it worthy of promotion to broader audiences.
Using your stats checker, pay close attention to the first 30 seconds of your video. This initial segment typically experiences the steepest drop-off. If your curve drops by more than 30% within the opening moments, your hook is likely failing to capture attention, or your intro contains unnecessary fluff. High-performing channels aim to retain at least 60% to 70% of viewers past the 30-second mark.
Beyond the intro, inspect the rest of the retention graph for sudden dips and spikes. Dips highlight sections where viewers skipped forward or abandoned the video entirely, indicating slow pacing, confusing explanations, or uninteresting visual presentation. Spikes indicate moments viewers rewatched, pointing to highly engaging moments, detailed tutorials, or entertaining visual edits worth replicating in future content.
Method 2: Evaluating Click-Through Rate (CTR) and Thumbnail Performance
Impressions measure how often your video thumbnail appears on screens across YouTube, while Click-Through Rate (CTR) calculates the percentage of those impressions that convert into actual views. Even the highest-quality video will fail to gain traction if its thumbnail and title fail to generate clicks.
A YouTube Video Stats Checker allows you to track CTR trends over specific timeframes. When you publish a new video, the initial CTR from subscriber feeds is usually high. As YouTube expands your video’s reach to broader, non-subscribed audiences, CTR naturally declines. Monitoring this metric helps you determine whether your visual elements resonate beyond your core fanbase.
If your video receives high impressions but maintains a below-average CTR (typically under 4% to 5% in most competitive niches), your thumbnail and title combination requires immediate attention. Updating thumbnail imagery, introducing high-contrast text, or tweaking title phrasing can revive stagnant videos, signaling fresh interest to the algorithm and driving renewed traffic.
Method 3: Analyzing Traffic Sources to Fine-Tune Video SEO
Not all views carry equal strategic value. Understanding where your traffic originates helps you tailor your content production and search engine optimization strategy. YouTube traffic generally falls into three main categories: YouTube Search, Suggested Videos, and Browse Features.
| Traffic Source | Primary Metric Driver | Strategic Focus |
| YouTube Search | Keyword Relevance & Exact-Match Metadata | Target long-tail search queries, clear titles, and structured descriptions. |
| Suggested Videos | Viewer History, Topic Clustering & Watch Time | Craft complementary titles/topics to trigger recommendations beside major niche videos. |
| Browse Features | High Initial CTR & Strong Audience Engagement | Design punchy, curiosity-driven thumbnails optimized for home screen impressions. |
Tracking traffic distribution via your stats checker reveals how audiences discover your content. If Search drives most of your views, your SEO efforts are working, though long-term viral potential may be capped by total search volume. Conversely, if Browse Features or Suggested Videos dominate your traffic mix, your content appeals to general curiosity, opening the door to exponential view growth.
Method 4: Measuring Engagement Velocity and Viewer Signals
Engagement velocity refers to the speed at which viewers interact with your video through likes, comments, shares, and playlist saves immediately following publication. YouTube treats strong early engagement signals as evidence of high viewer satisfaction.
A comprehensive stats checker displays engagement ratios by calculating comments and likes per thousand views. A video generating high engagement relative to its view count signals strong community investment. Active comment sections also increase total session duration as viewers read and reply while the video continues to play.
To capitalize on engagement velocity, ask clear, specific questions within your video script rather than generic calls to action. Prompting viewers to share opinions on controversial niche topics or choose between two options naturally stimulates comment activity, accelerating early performance signals.
Alt Text: A detailed chart showing traffic sources including search, suggested videos, and browse features generated by a statistics tracker.
Method 5: Tracking Audience Demographics and Regional Preferences
Understanding who watches your content is essential for refining your editorial calendar and brand monetization strategy. Statistical tracking tools aggregate demographic metrics, including age distributions, gender ratios, primary geographic locations, and subtitle usage rates.
Analyzing regional metrics helps optimize upload scheduling. If your stats checker reveals that 40% of your audience resides in North America while 30% is based in Western Europe, publishing during overlapping active hours ensures maximum real-time reach upon release.
Demographic data also plays a major role in securing sponsorships. Brands look for alignment between a channel’s viewer profile and their target customer base. Demonstrating precise demographic breakdown from an independent stats tool gives potential brand partners confidence in your channel’s commercial reach.
Method 6: Benchmarking Performance Against Niche Competitors
Evaluating your channel’s metrics in isolation offers limited context. A 5% CTR might mark an improvement for your channel, but it could fall behind the average within a highly competitive vertical like gaming or financial commentary.
Using a YouTube Video Stats Checker for competitive benchmarking helps establish realistic expectations for your niche. By inputting competitor video URLs, you can analyze view velocity patterns, estimated daily watch time, and common tag usage across rival channels.
This comparative approach highlights content formats currently outperforming market baselines. If a competitor experiences a surge on a specific topic, you can develop your unique perspective on that theme while it retains high audience demand.
Method 7: Monitoring Revenue Metrics, RPM, and CPM Trends
For creators enrolled in the YouTube Partner Program, financial performance metrics are just as vital as audience reach. Understanding Revenue Per Mille (RPM) and Cost Per Mille (CPM) allows you to turn your channel into a reliable business.
CPM reflects what advertisers pay for every 1,000 ad impressions, while RPM measures the actual revenue earned per 1,000 total video views after YouTube’s platform cut. Factors influencing these figures include viewer geography, video topic, length, and ad placement density.
Regularly reviewing financial metrics in your stats tool helps evaluate the business impact of your content strategy. Videos covering specialized technical topics, software reviews, or business strategies consistently command higher RPMs than general entertainment shorts. Balancing broad-reach content with high-RPM niche topics helps build a steady, diversified income stream.
4. Supercharging Your Channel Growth with Modern AI Utilities
Managing a successful YouTube channel requires wearing multiple hats: strategist, scriptwriter, SEO specialist, and data analyst. Integrating modern digital utilities alongside your analytics workflow makes managing these responsibilities far more efficient.
For creators looking to streamline workflow tools and web utility management, platforms like AI Tool Synergy provide curated access to essential online utilities. Utilizing dedicated tool hubs helps creators save time spent searching for reliable single-purpose applications, allowing them to keep their focus on video production and growth.
When your statistical analysis indicates a need to refresh underperforming video metadata, leveraging dedicated text generation tools can accelerate the optimization process. By using advanced text models available through platforms like Copy AI Tools, creators can easily generate dynamic title alternatives, optimized video descriptions, and engaging hook variations tailored to viewer preferences.
+-----------------------------------------------------------------------+
|                   DATA-DRIVEN CONTENT WORKFLOW                        |
+-----------------------------------------------------------------------+
| 1. ANALYZE PERFOMANCE  --> Use YouTube Video Stats Checker to flag     |
|                            low CTR or early retention drop-offs.      |
|                                                                       |
| 2. OPTIMIZE CREATIVE   --> Leverage Copy AI Tools to generate punchy  |
|                            new titles, hooks, and descriptions.       |
|                                                                       |
| 3. INTEGRATE UTILITIES --> Utilize AI Tool Synergy web utilities to   |
|                            streamline publishing assets and tags.     |
|                                                                       |
| 4. RE-EVALUATE & SCALE --> Re-check stats after 48 hours to confirm   |
|                            impression and CTR recovery.               |
+-----------------------------------------------------------------------+
Combining data insights from a YouTube Video Stats Checker with AI-driven content generation creates a systematic approach to channel optimization. Instead of guessing how to rewrite a weak intro or title, you rely on empirical data to guide your updates, saving time while steadily improving content performance.
Alt Text: An overview illustration showing how creators combine YouTube video statistics checking with AI software utilities for scriptwriting and title generation.
5. How to Build a Weekly Analytics Routine Using Your Video Stats
Having access to data is useless without a structured framework to process it. Establishing a consistent weekly analytics routine prevents information overload and keeps your optimization efforts focused on key performance drivers.
Phase 1: The 24-Hour Post-Upload Audit
During the first day following a new video release, focus on immediate distribution signals. Check your stats tool to evaluate early view velocity, subscriber conversion numbers, and initial impression CTR.
- Action Step: If CTR is significantly lower than your channel’s 24-hour baseline, replace the thumbnail immediately and test a tighter, more curious title phrasing.
Phase 2: The 7-Day Performance Review
One week after publishing, early audience noise settles, revealing clearer algorithmic trends. Focus your evaluation on audience retention curves and traffic source distribution.
- Action Step: Note the exact timestamp where viewer drop-off accelerates. Use these insights during your next editing session to remove visual slowdowns or improve verbal transitions.
Phase 3: The 30-Day Evergreen Audit
After one month, evaluate whether your video has transitioned into an evergreen asset (driven by Search and Suggested placement) or if performance has flattened out completely.
- Action Step: For videos showing high search intent but declining impressions, expand the video description by adding timestamps, related search terms, and updated links to newer channel uploads.
6. Common Analytics Pitfalls That Hold Creators Back
While data is essential for growth, misinterpreting metrics can lead creators to make counterproductive adjustments. Recognizing common analytical errors helps preserve creative direction while optimizing channel performance.
+---------------------------------------------------------------------+
|                  COMMON YOUTUBE ANALYTICS MISTAKES                  |
+---------------------------------------------------------------------+
| [!] Obsessing Over Total Views While Ignoring Average Duration      |
| [!] Changing Thumbnails Too Quickly Before Gathering Enough Data    |
| [!] Treating Short-Term Algorithmic Fluctuations as Channel Failure |
| [!] Comparing Small-Niche Metrics Directly to Viral Topics          |
+---------------------------------------------------------------------+
Falling into the Vanity Metrics Trap
High view counts look impressive, but they can be misleading if viewed in isolation. A video with 50,000 views and an average watch time of 45 seconds often generates less algorithmic authority and lower revenue than a video with 10,000 views and an average watch time of 8 minutes. Always evaluate views alongside watch time and retention percentage.
Over-Reacting to Short-Term Data Fluctuation
YouTube’s recommendation algorithms constantly test videos across different viewer segments. These tests can produce temporary drops in CTR or retention metrics. Changing titles, thumbnails, and descriptions multiple times within a few hours prevents the algorithm from gathering a clean sample set, often extending performance lulls unnecessarily.
Ignoring Niche Baseline Differences
Different content categories exhibit vastly different baseline performance metrics. Educational, highly technical tutorials typically register lower overall CTRs and view counts compared to viral entertainment shorts, but they achieve much higher audience retention and revenue per view. Always benchmark your stats against direct niche competitors rather than broad YouTube trends.
7. Frequently Asked Questions (FAQs)
What is a YouTube Video Stats Checker?
A YouTube Video Stats Checker is an analytical utility that tracks, processes, and displays key performance data for YouTube videos and channels. It provides detailed metrics on view velocity, audience retention, CTR, metadata optimization, and engagement rates to help creators improve their channel strategies.
Why is audience retention more important than view count?
Audience retention measures how long viewers stay engaged with your content. The YouTube algorithm prioritizes watch time and satisfaction over raw clicks. A video that keeps viewers watching longer signals high content quality, making YouTube far more likely to recommend it across home feeds and suggested video bars.
How often should I monitor video statistics?
Perform a quick check 24 hours post-upload to confirm CTR and thumbnail performance. Conduct deeper reviews at 7 days and 30 days to evaluate retention trends, traffic sources, and evergreen growth potential without over-reacting to short-term data fluctuations.
What is a good Click-Through Rate (CTR) on YouTube?
Across the platform, average video CTR ranges between 2% and 10%. However, a “good” CTR depends heavily on your niche and traffic source. Broad viral content often sees lower CTRs as impressions scale, while targeted search-driven tutorials can maintain CTRs above 8% to 12%.
How can AI tools improve my video stats?
AI utilities assist in analyzing data trends and executing metadata improvements. If your stats checker reveals a low CTR, AI generators can quickly propose optimized titles, punchy hooks, and search-friendly descriptions to help revive underperforming videos.
8. Final Thoughts: Turning Insights into Lasting YouTube Authority
Achieving sustained success on YouTube is rarely a matter of luck. Channels that grow consistently treat content creation as an iterative science, backed by steady analytical review. Using a reliable YouTube Video Stats Checker gives you direct visibility into how audiences discover, evaluate, and watch your videos.
By tracking core metrics—including audience retention, click-through rates, traffic source distribution, and engagement velocity—you gain clear direction on how to refine your creative and technical decisions. Paired with modern digital workflows and production tools, data-driven optimization turns channel management from a series of wild guesses into a reliable, repeatable strategy for long-term growth.
Review your analytics regularly, adapt based on viewer feedback, and let real-time data guide your path toward building a thriving, authoritative YouTube channel.